Exhibit 99.1


Forward-Looking Statements
2
This presentation contains forward-looking statements. All statements other than statements of historical
facts contained in this presentation, including statements regarding Micronet Enertec’s future results of
operations and financial position, financial targets, business strategy, plans and objectives for future
operations, are forward-looking statements. The Company has based these forward-looking statements
largely on its current estimates of its financial results and its current expectations and projections about
future events and financial trends that it believes may affect its financial condition, results of operations,
business strategy, short-term and long-term business operations and objectives, and financial needs as of
the date of this presentation. These forward-looking statements are subject to a number of risks,
uncertainties and assumptions. Moreover, the Company operates in a very competitive and rapidly
changing environment. New risks emerge from time to time. It is not possible for Company management
to predict all risks, nor can the Company assess the impact of all factors on its business or the extent to
which any factor, or combination of factors, may cause actual results to differ materially from those
contained in any forward-looking statements the Company may make. In light of these risks, uncertainties
and assumptions, the forward-looking events and circumstances discussed in this presentation may not
occur and actual results could differ materially and adversely from those anticipated or implied in the
forward-looking statements.
More detailed information about the risk factors affecting the Company’s performance is available under
the heading “Risk Factors” in the Company’s Annual Report on form 10-K filed with the Securities and
Exchange Commission (the “SEC”) on March 29, 2013, which is available on the SEC’s website,
www.sec.gov. Readers are cautioned not to place undue reliance on these forward-looking statements,
which reflect management’s analyses only as of the date hereof. The Company neither intends to, nor
assumes any obligation to, update or revise these forward-looking statements in light of developments
that differ from those anticipated.

Statement on Pro Forma Financials
The pro forma condensed consolidated financial information included in this investor presentation
is constructed from the separate financial statements of the Company and Micronet Ltd.
(“Micronet”), in which the Company has a controlling interest, and may not represent the financial
information that would result from operations of the combined companies. In addition, the pro
forma condensed consolidated financial information included in this investor presentation is based
in part on certain assumptions that we believe are reasonable. We cannot assure you that our
assumptions will prove to be accurate over time. Accordingly, the historical and pro forma
condensed consolidated financial information included in this investor presentation may not reflect
what the Company’s results of operations and financial condition would have been had we been a
combined entity during the periods presented, or what our results of operations and financial
condition will be in the future. The challenge of integrating previously independent businesses
makes evaluating our business and our future financial prospects difficult. Our potential for future
business success and operating profitability must be considered in light of the risks, uncertainties,
expenses and difficulties typically encountered by recently combined companies.
3
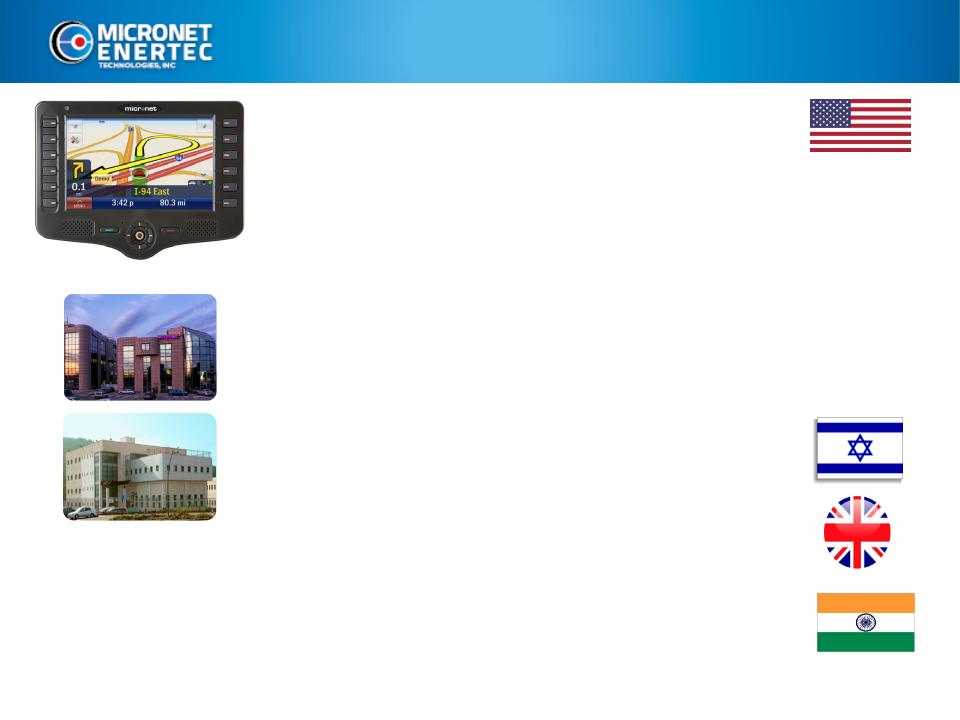
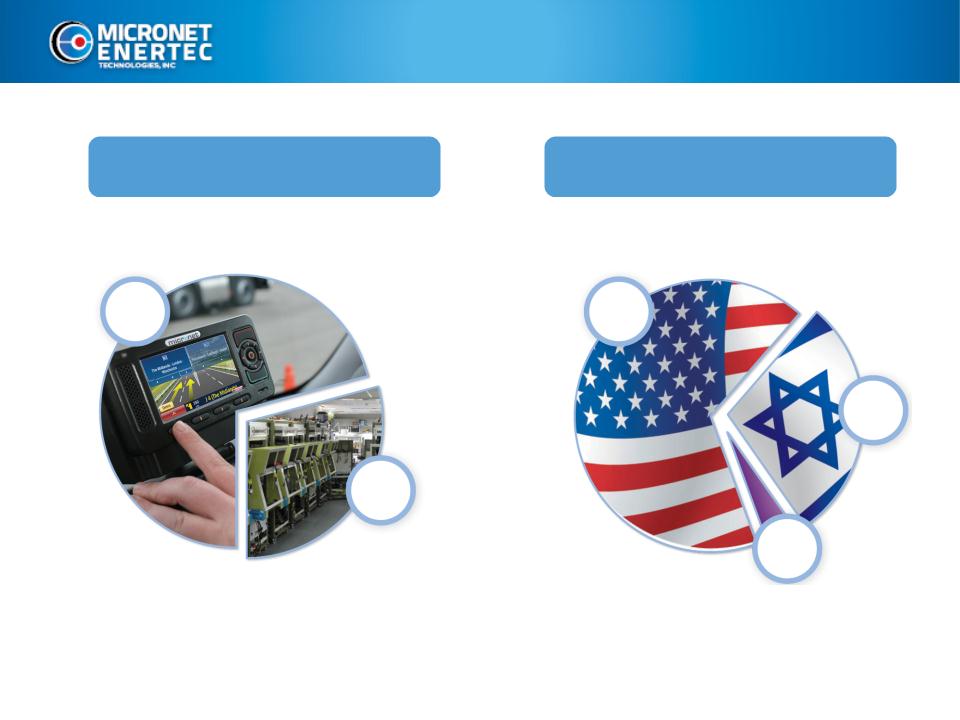
Micronet Enertec Technologies Inc.
NASDAQ: MICT
NASDAQ: MICT
4
• Delaware corporation, USA based
• Develop, manufacture & market:
§ Advanced mobile ruggedized computers, tablets and equipment that are
embedded & integrated in commercial applications
• Focus on two billion-dollar vertical markets
1. Aerospace/Defense
2. Mobile Resource Management (MRM) / Fleet Management (FM)
§ 23% CAGR for global MRM market and expect continued growth
• Corporate structure
§ Own 100% Enertec Systems - Aerospace/Defense
§ Own 54% Micronet Ltd - MRM & FM
• R&D and operating subsidiaries: Israel
• Joint venture: India
• Sales presence: United Kingdom
5
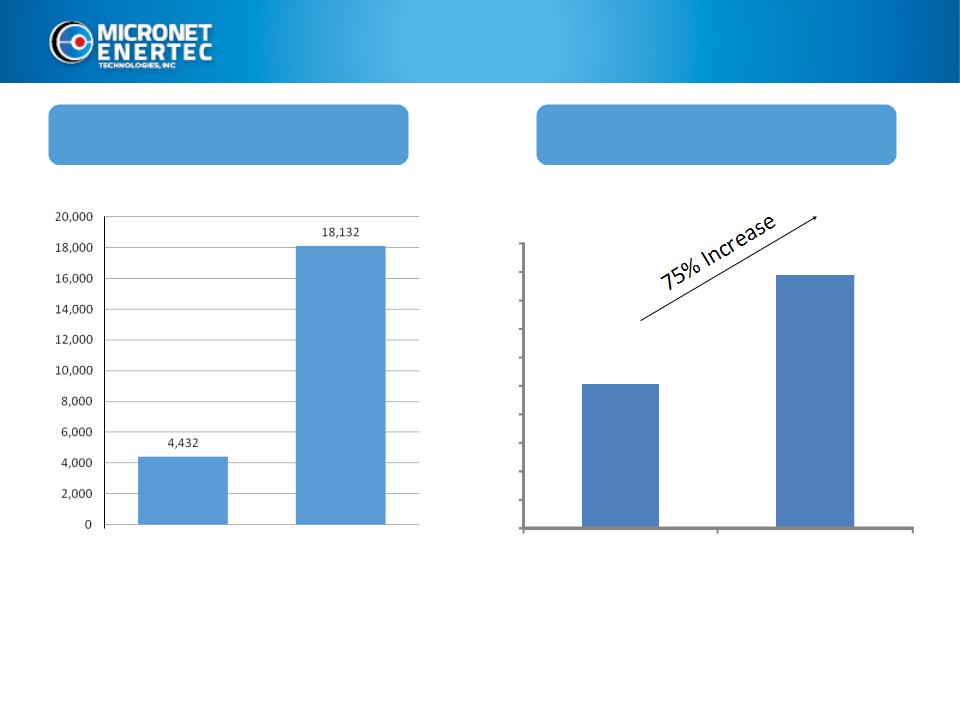
Revenue Performance
Six Month 2013 GAAP
Annual GAAP
(includes only 1 quarter of Micronet results)
Year Ended December 31
Jan-June 2012 Jan-June 2013
$10,146
$17,788
$0
$2,000
$4,000
$6,000
$8,000
$10,000
$12,000
$14,000
$16,000
$18,000
$20,000
2011
2012
Revenue (000)
10,146 17,778 2,000 4,000 6,000 8,000 10,000 12,000 14,000 16,000 18,000 20,000 75 % Increase 4,432 18,132 2,000 4,000 6,000 8,000 10,000 12,000 14,000 16,000 18,000 20,000 Jan - June 2012 Jan - June 2013
Six Month 2013 Revenue Breakdown
6
Revenue by Segment
Revenue by Geography
MRM
Aerospace
79%
21%
67%
4%
29%
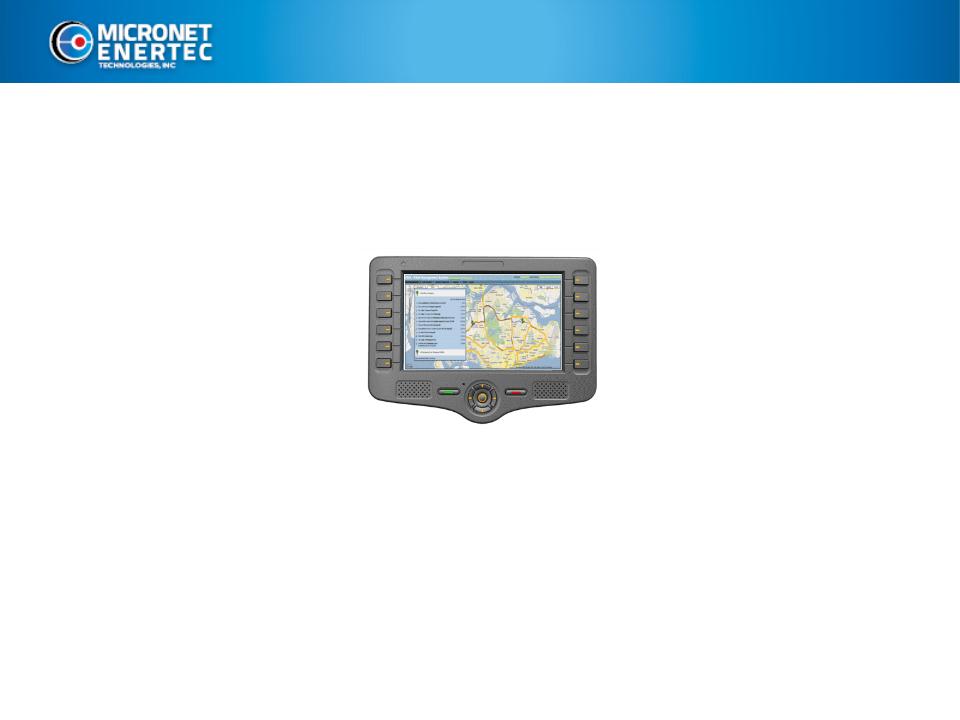
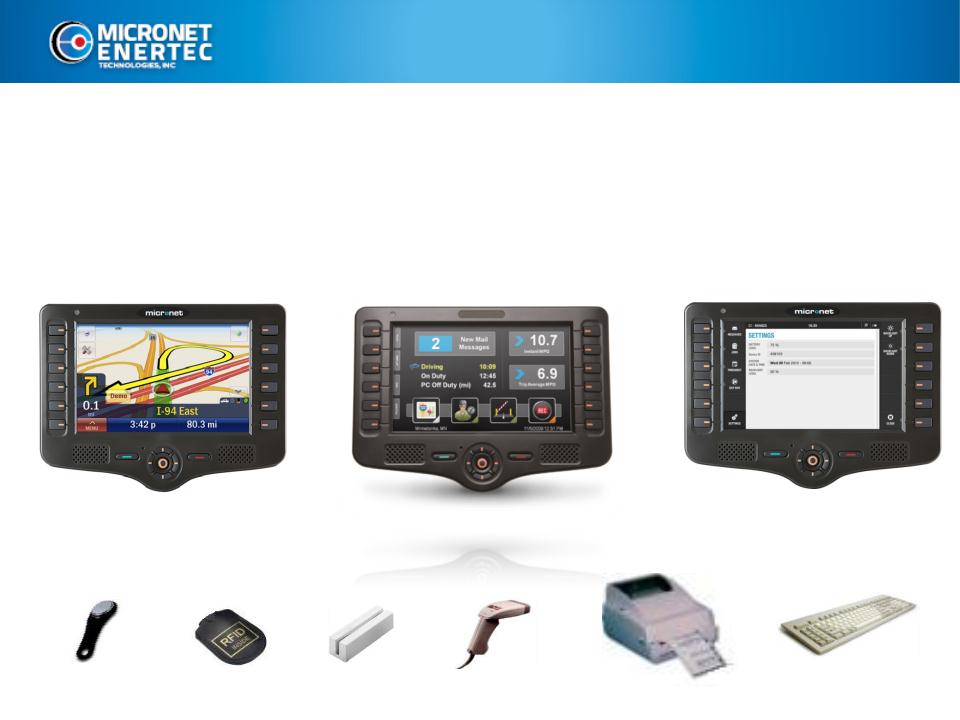
Rugged Tablet Computers for MRM/FM
7
Our mobile fleet management computers help maximize
productivity, reduce costs and improve corporate control by
automating manual workflow processes
productivity, reduce costs and improve corporate control by
automating manual workflow processes
• We provide robust programmable automotive-grade mobile computers
• We supply top-tier fleet management service companies
• We design, develop and manufacture our products in-house
Fit-for-purpose Rugged Tablet Computers
8
Our products are designed to integrate with vehicle power sources
and computer systems, and built to withstand wide temperature
ranges, shock & vibrations, and connect to ancillary devices.
and computer systems, and built to withstand wide temperature
ranges, shock & vibrations, and connect to ancillary devices.
Cellular
GPS
W/LAN
CANBus
Bluetooth
USBs
LAN
Comm Ports
12V/24V

MRM Applications
9
• Time Management and Safety Compliance
• Two-Way Messaging and Task Management
• Dynamic Dispatching and Navigation
• Form-based Reporting
• Proof of Delivery and Invoicing
Key Worker / Workflow Applications

MRM Sectors
10
• Haulage & Distribution
• Construction Supply
• Local Fleets - Technical Services
• Public Transportation - Buses & Taxis
• Municipalities & Utilities
• Public Safety - Police, Fire, Ambulances
Main vertical markets
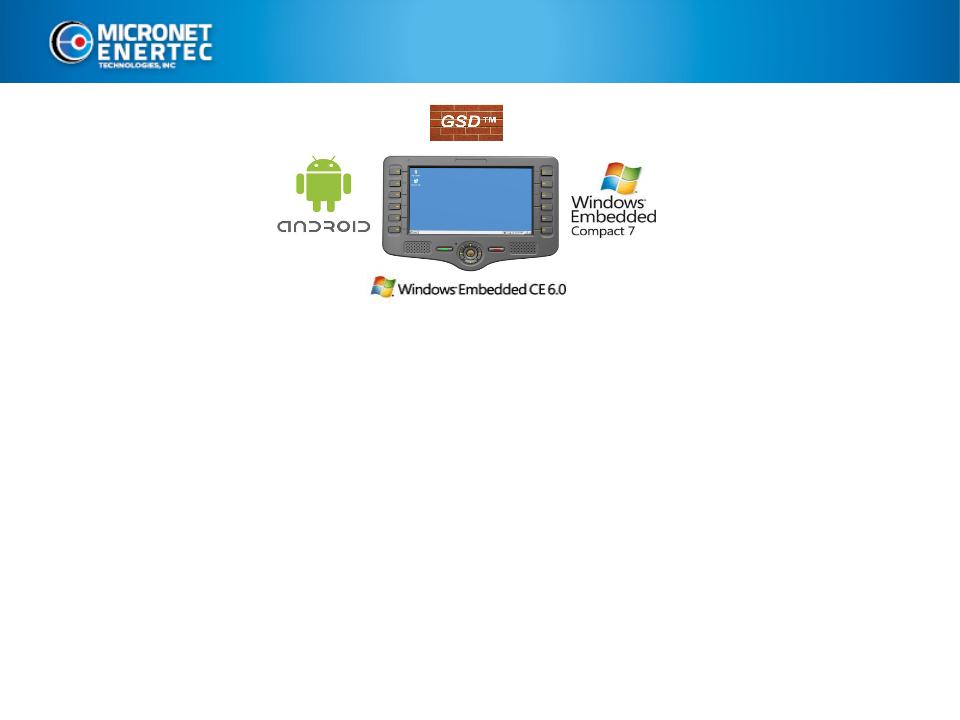
Patent-pending Guardian System Design (GSD) - Cloud-based SaaS
functionality enables remote device monitoring and facilitates user
support and technical trouble shooting
functionality enables remote device monitoring and facilitates user
support and technical trouble shooting
• Remote mobile device management
• Fail-safe and cost effective Firmware and Application Over the Air
(OTA) updates
(OTA) updates
• Recurring revenue business model
Micronet Innovation
11
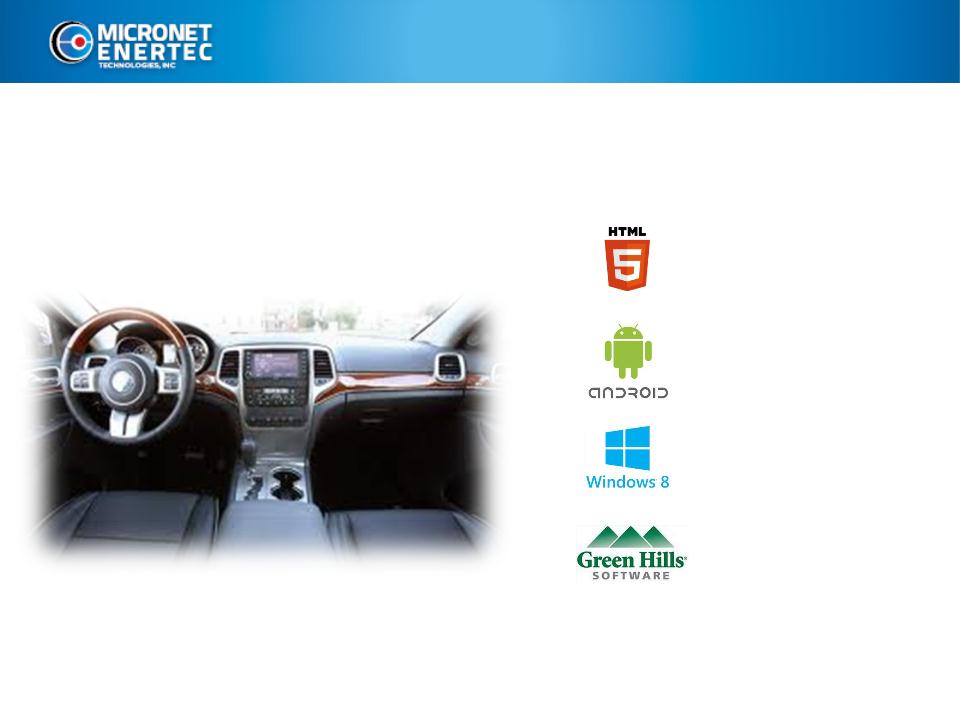
Platform to serve after-market solutions & truck OEMs
Cloud world
Infotainment
Enterprise
HMI control,
Diagnostics &
virtualization
Micronet Technology Vision
12
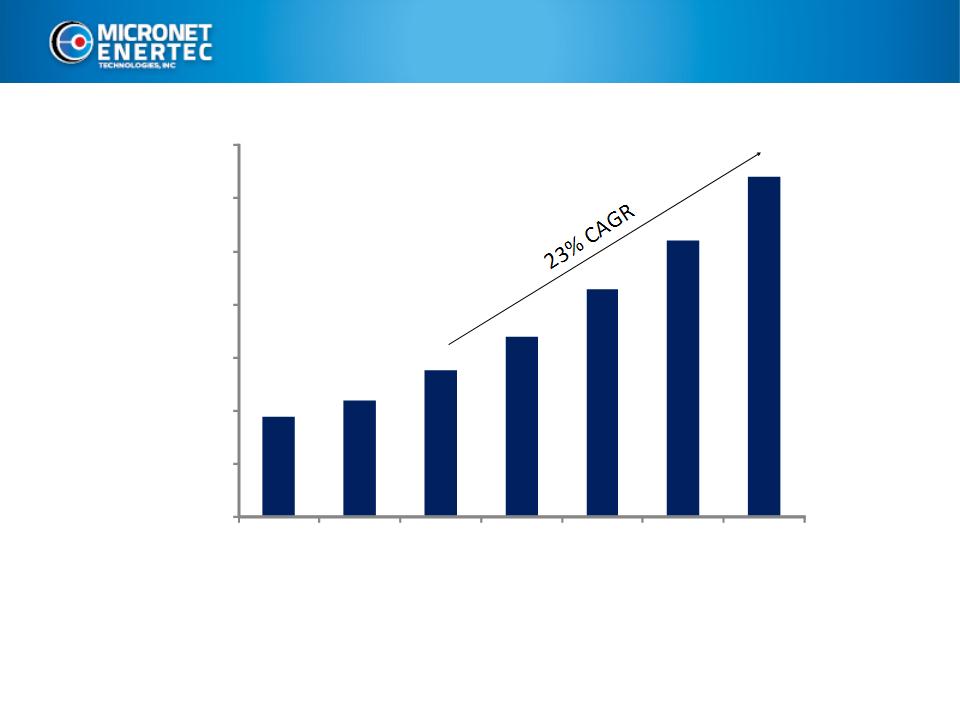
Global MRM Market
13
• 13.8 million subscribers as of December 2012
• Expected to grow to 32 million in 2016
• 700,000 companies using MRM today
Sources: C.J. Driscoll & Associates and Licht & Associates, 2012
-
5,000,000
10,000,000
15,000,000
20,000,000
25,000,000
30,000,000
35,000,000
2010
2011
2012E
2013P
2014P
2015P
2016P
MRM Subscribers
23% CAGR
U.S. MRM Market
14
U.S. MRM market today has more than 5 million units in service
• Total U.S. MRM market projected to grow to 9 million units in service by 2015
• 300,000+ companies use MRM systems and services
Source: C.J. Driscoll & Associates
Every million units represent a $400 million revenue opportunity for Micronet
-
1,000,000
2,000,000
3,000,000
4,000,000
5,000,000
6,000,000
7,000,000
8,000,000
9,000,000
10,000,000
2011
2012E
2013P
2014P
2015P
MRM Subscribers
Heavy Equipment Monitoring
Trailer/Container Monitoring Systems
Installed Units
-
Long Haul Trucking
GPS
-
Capable Cell Phones/Smartphones/Tablets
Installed Units
-
Local Fleet Market
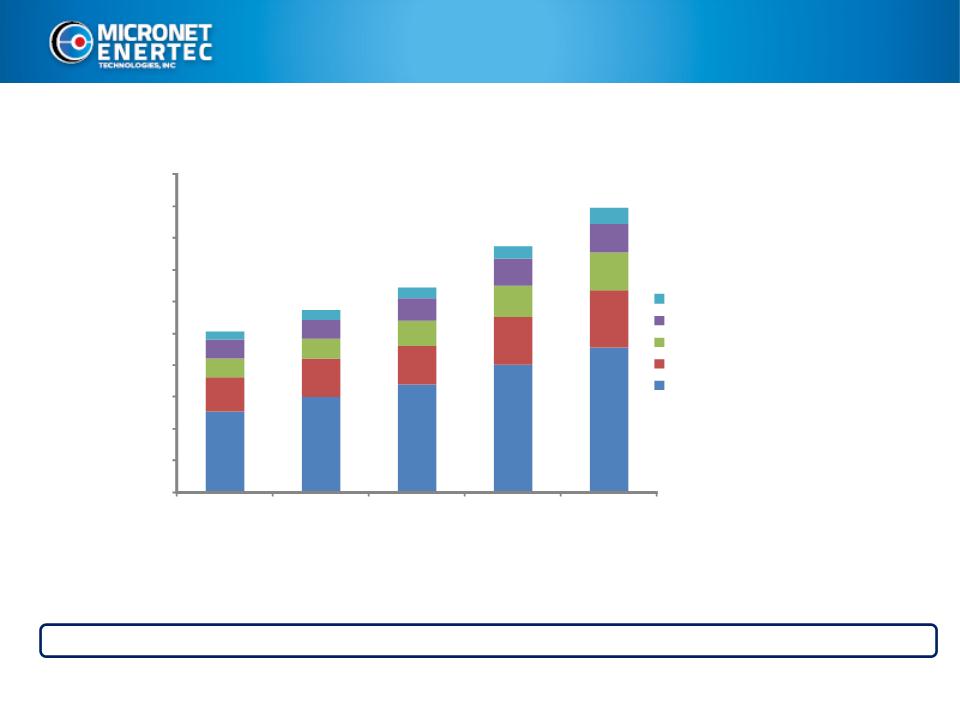
U.S. MRM Growth Analysis
15
• The U.S. is approximately 40% of the global MRM market
• Micronet has already penetrated and sells to major MRM service providers and is
positioned to take a significant share of the U.S. and global market
positioned to take a significant share of the U.S. and global market
3-year potential of 3 million units @ $400/unit
= $1.2 billion in relevant U.S. revenue opportunity (2013-2015)
Sources: Micronet and C.J. Driscoll & Associates
(1) Approximately 20% of installed units are replaced annually
(2) Assumes that 33% of Local Fleet applications are relevant to Micronet
Vertical
2012
Subscribers
2015
Subscribers
New
Subscriber
Growth
Replacement
Units
(1)
Total New
Units
Relevant to
Micronet
(2)
Local Fleet
2,900,000
4,550,000
1,650,000
2,400,000
4,050,000
1,350,000
GPS iPhones
1,230,000
1,800,000
570,000
966,000
1,536,000
-
Long Haul
700,000
1,200,000
500,000
620,000
1,120,000
1,120,000
Trailers/Containers
670,000
950,000
280,000
514,000
794,000
-
Heavy Equipment
200,000
500,000
300,000
240,000
540,000
540,000
Total 5,700,000 9,000,000 3,300,000 4,740,000 8,040,000 3,010,000

Fleet Management Customers
16
Trimble Inc. (NASDAQ: TRMB): A $7 billion market cap corporation,
the second largest provider of FM and MRM solutions with 370,000
installed units
the second largest provider of FM and MRM solutions with 370,000
installed units
Teletrac Inc.: A provider of advanced and interactive fleet
automation software based in California. Teletrac provides solutions
to more than 20,000 fleets with 200,000 vehicles
automation software based in California. Teletrac provides solutions
to more than 20,000 fleets with 200,000 vehicles
Imarda Ltd: A provider of fleet management solutions based in
Australia and New Zealand
Australia and New Zealand
Belgravium Technologies PLC (AIM: BVM): A market leader in
enterprise mobile computing solutions with an installed global
product base of over 300,000 terminals
enterprise mobile computing solutions with an installed global
product base of over 300,000 terminals
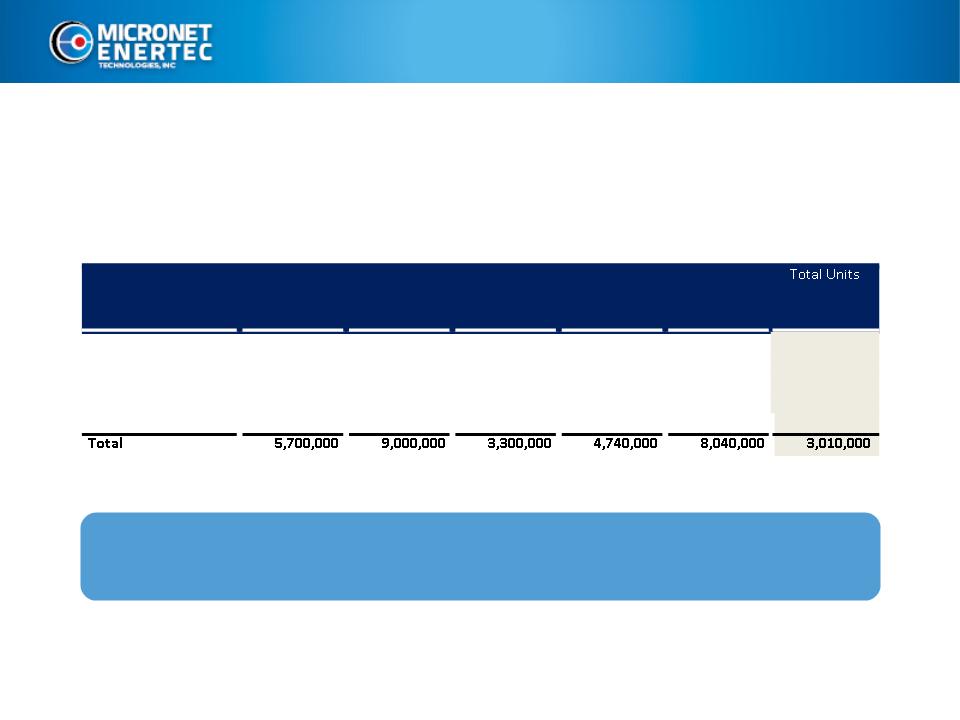
Aerospace & Defense Systems
17
MICT military computers and equipment are embedded in the core of
electronic platforms, including: missiles, tanks, combat aircraft, drones,
missile boats, submarines, command and control systems
electronic platforms, including: missiles, tanks, combat aircraft, drones,
missile boats, submarines, command and control systems
Command &
Tracking
Systems
Tracking
Systems
Naval
Communications
Systems
Communications
Systems
Operations
Consoles for
Weapon
Systems
Consoles for
Weapon
Systems
Ground
Command
Systems
Command
Systems
Naval Control
Systems
Systems
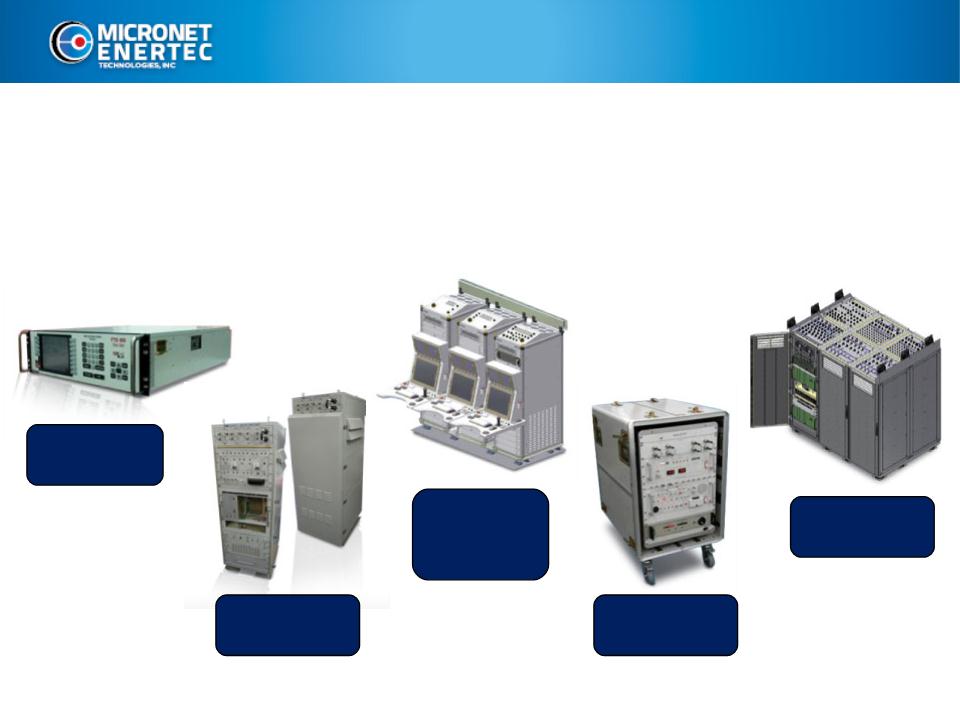
Critical Missile Defense Technologies
18
MICT Computers and Equipment are Integrated into Critical Missile
Defense Systems
Defense Systems
Our systems and technology are embedded in the Arrow and Iron Dome missile
programs as well as in naval platforms
programs as well as in naval platforms

19
President Obama - Iron Dome Missiles (command and control computers by MICT)
Critical Missile Defense Technologies

Missile Defense Customers
20
Israel Aerospace Industries (IAI): With annual revenues of over $3
billion, IAI is the largest aerospace and defense company and the
largest industrial exporter in Israel. Globally recognized leader in
development and production of military and commercial aerospace
and defense systems
billion, IAI is the largest aerospace and defense company and the
largest industrial exporter in Israel. Globally recognized leader in
development and production of military and commercial aerospace
and defense systems
Rafael Advanced Defense Systems Ltd: A $1.8 billion revenue
defense corporation involved in all critical projects used by the Israeli
defense forces and many foreign ones
defense corporation involved in all critical projects used by the Israeli
defense forces and many foreign ones
Elbit Systems Ltd. (NASDAQ and TASE:ESLT): A $3 billion revenue
defense contractor with operations in Israel and the U.S.
defense contractor with operations in Israel and the U.S.
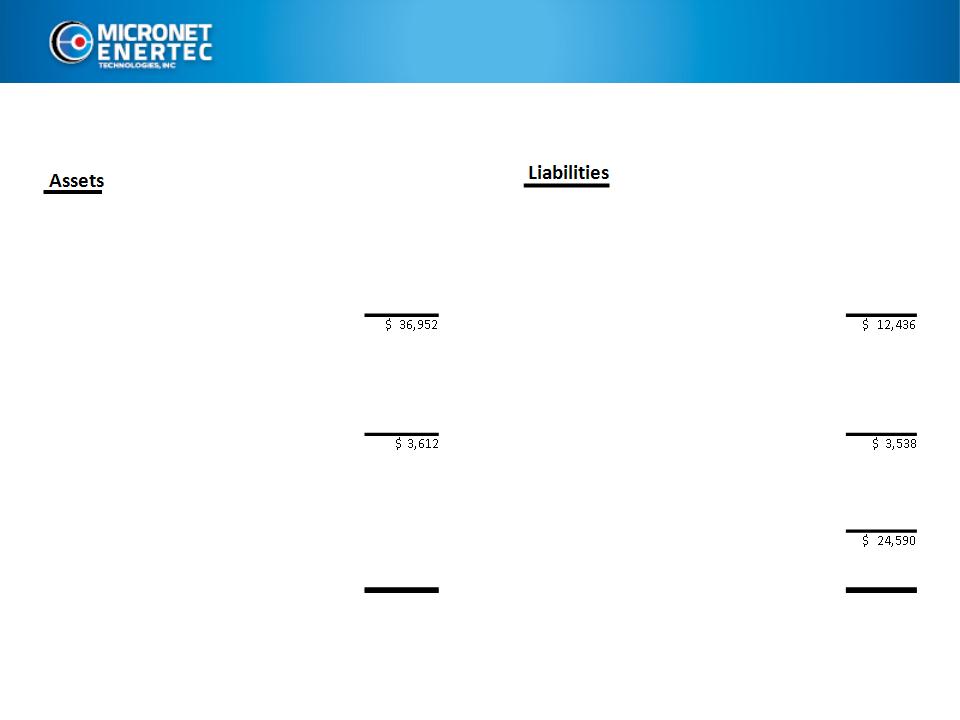
Summary Balance Sheet
21
June 30, 2013 - ($000’s)
Current Assets
Current Liabilities
Cash, cash equivalents & marketable securities
19,189
$
Short-term and current portion of long-term debt
(1)
6,978
$
Accounts Reveivables
10,723
Account Payables
5,436
Inventories
5,325
Other current
22
Other current
1,715
Total current assets
Total current liabilities
Property and equipment, net
2,297
Long-term debt and others
(1)
3,139
Intangible assets and others, net
1,271
Other long-term
399
Long-term deposit
44
Total long-term assets
Total long-term liabilities
Shareholders Equity
Micronet Enertec stockholders
17,577
Non controlling interest
7,013
Total equity
Total Assets
40,564
$
Liabilities and shareholders equity
40,564
$
Long-term assets
Long-term liabilities
$36,952 $12,436 $3,612 $3,538 $24,590

Six Month Highlights 2013 vs. 2012
22
• Revenue: Growth of 309% from $4.4M to $18.1M.
• Operational Income: Increased from $452K to $2.3M.
• Revenue -Aerospace division (Enertec) : A growth of 18%.
• Revenue -MRM Division (Micronet) : A decline of 11%.
• Gross Margin: Increased from 34% to 36%
• EBITDA: Increased from $498K to $3M.

Six Month Summary Financial Data
|
Six months ended
June 30,
|
||||||||
|
2013
|
2012
|
|||||||
|
in thousands
|
in thousands
|
|||||||
|
Revenues
|
$ | 18,132 | $ | 4,432 | ||||
|
Cost of revenues
|
11,618 | 2,915 | ||||||
|
Gross profit
|
6,514 | 1,517 | ||||||
|
Operating expenses:
|
||||||||
|
Research and development
|
1,389 | 109 | ||||||
|
Selling and marketing
|
678 | 175 | ||||||
|
General and administrative
|
1650 | 781 | ||||||
|
Amortization of intangible assets
|
471 | - | ||||||
|
Total operating expenses
|
4,188 | 1,065 | ||||||
|
Income from operations
|
2,326 | 452 | ||||||
|
Financial expenses, net
|
(1,848 | ) | (417 | ) | ||||
|
Other income
|
- | 21 | ||||||
|
Income before provision for income taxes
|
478 | 56 | ||||||
|
Taxes on income
|
130 | 12 | ||||||
|
Share in profit of affiliated company
|
- | (17 | ) | |||||
|
Net income
|
348 | 27 | ||||||
|
Net income attributable to non-controlling interests
|
1,037 | - | ||||||
|
Net Income (loss) attributable to Micronet Enertec
|
(689 | ) | 27 | |||||
23
24
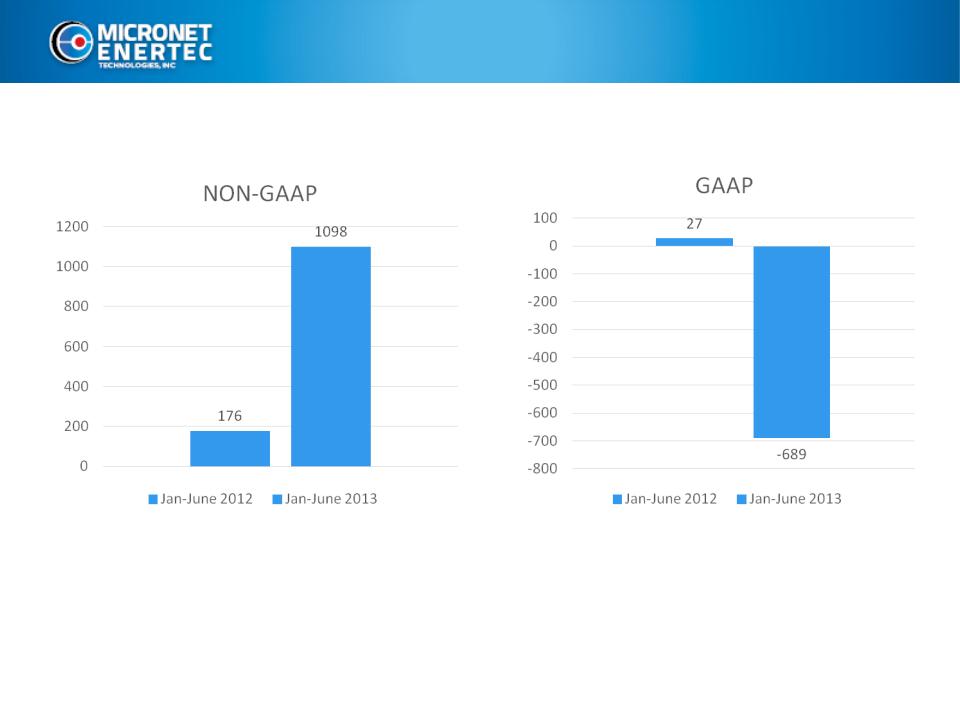
Six Month Net Income Performance
($ in thousands)
176 1098 0 200 400 600 800 1000 1200 NON - GAAP Jan - June 2012 Jan - June 2013 24 27 - 689 - 800 - 700 - 600 - 500 - 400 - 300 - 200 - 100 0 100 GAAP Jan - June 2012 Jan - June 2013
Six Month Consolidated Statements of Income
($ in thousands)
($ in thousands)
|
|
Jan-June 2013
|
|
Jan-June 2012
|
|
|
Sales
|
18,132
|
|
4,432
|
|
|
Gross profit
|
6,514
|
36%
|
1,517
|
34%
|
|
Operating expenses
|
4,188
|
23%
|
1,065
|
24%
|
|
Income from
operations |
2,326
|
13%
|
452
|
10%
|
|
Net GAAP Income
(Loss) |
(689)
|
(4%)
|
27
|
1%
|
|
Net NON GAAP
Income (Loss) |
1,098
|
6%
|
176
|
4%
|
25
Six Month Non-GAAP Financial Measures
($ in thousands)
($ in thousands)
26
|
|
Jan-June
2013 |
Jan-June
2012 |
|
Net income (loss) attributable to Micronet Enertec
|
(689)
|
27
|
|
Amortization of acquired intangible assets
|
471
|
|
|
Change in fair value of warrants
|
193
|
(17)
|
|
Amortization of UTA's note discount and related expense
|
1,188
|
166
|
|
Stock-based compensation
|
6
|
|
|
Income tax-effect of above non-GAAP adjustments
|
(71)
|
|
|
Total non-GAAP net income attributable to Micronet Enertec
|
1,098
|
176
|
|
Non-GAAP net income per diluted share
|
0.29
|
0.05
|
|
Shares used in per share calculations
|
3,727,372
|
3,241,500
|
|
|
|
|
|
GAAP Net income (loss) per share
|
(0.18)
|
0.01
|
Six month Financial Expenses
($ in thousands)
($ in thousands)
|
|
Jan-June
2013 |
Jan-June
2012 |
|
Change in the fair value of the put
and call options |
193
|
-
|
|
Amortization of discount
|
1,188
|
166
|
|
Interest and Exchange differences
|
467
|
251
|
|
Financial expense, net
|
1,848
|
417
|
27
Second Quarter Consolidated Statements of Income
($ in thousands)
($ in thousands)
|
|
April-June 2013
|
|
April-June 2012
|
|
|
Sales
|
7,771
|
|
2,480
|
|
|
Gross profit
|
2,868
|
37%
|
924
|
37%
|
|
Operating expenses
|
2,003
|
26%
|
511
|
21%
|
|
Income from
operations |
865
|
11%
|
413
|
17%
|
|
Net GAAP Income
(Loss) |
(227)
|
(3%)
|
176
|
7%
|
|
Net NON - GAAP
Income (Loss) |
372
|
5%
|
250
|
10%
|
28
Second Quarter Non-GAAP Financial Measures
($ in thousands)
($ in thousands)
|
|
April-June
2013 |
April-June
2012 |
|
Net income (loss) attributable to Micronet Enertec
|
(227)
|
176
|
|
Amortization of acquired intangible assets
|
93
|
|
|
Change in fair value of warrants
|
(105)
|
(9)
|
|
Amortization of UTA's note discount and related
expenses |
619
|
83
|
|
Stock-based compensation
|
6
|
|
|
Income tax-effect of above non-GAAP adjustments
|
(14)
|
|
|
Total non-GAAP net income attributable to Micronet
Enertec |
372
|
250
|
|
Non-GAAP net income per diluted share
|
0.07
|
0.08
|
|
Shares used in per share calculations
|
5,211,888
|
3,241,500
|
|
|
|
|
|
GAAP Net income (loss) per share
|
(0.04)
|
0.05
|
29

Second Quarter Financial Expenses
($ in thousands)
($ in thousands)
|
|
4-6.2013
|
4-6.2012
|
|
Change in the fair value of the put
and call options |
(105)
|
-
|
|
Amortization of discount
|
620
|
83
|
|
Interest and Exchange differences
|
202
|
163
|
|
Financial expense, net
|
717
|
246
|
30

Summary Financial Data, 2011-2012
31
(1) For 2012, the loss of $325 includes $1,171 of inventory amortization and $551 of intangible asset amortization, if excluded, income from operations would have been $1,397
For the year ended
December 31
2012
2011
(in thousands, except share and per share amounts)
Consolidated Statement of Operations Data:
Revenue
17,788
$
10,146
$
Cost of revenue
13,790
6,297
Gross profit
3,998
3,849
Operating Expenses
4,323
1,956
Income (loss) from operations
(1)
(325)
1,893
Other (loss) income
4,893
(534)
Net income
4,568
1,359
Net income attributable to Micronet Enertec
5,417
$
1,359
$
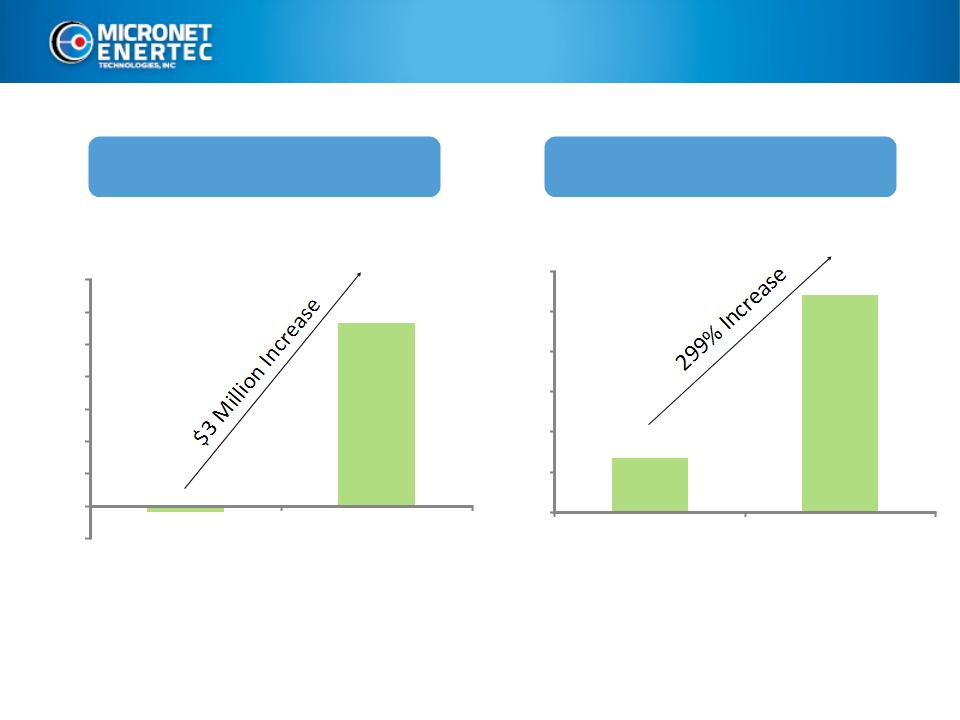
Annual Net Income Performance
32
Consolidated Pro Forma
GAAP
Year Ended December 31
Year Ended December 31
($82)
$2,840
($500)
$0
$500
$1,000
$1,500
$2,000
$2,500
$3,000
$3,500
2011
2012
$1,359
$5,417
$0
$1,000
$2,000
$3,000
$4,000
$5,000
$6,000
2011
2012
Net Income (000)
$3 Million Increase, 299% Increase

Comparable Companies
33
(figures in millions, except per share data)
Price (1)
52 - Week
Equity
Firm
Firm Value / Revenue
Firm Value / EBITDA
Price / Earnings
Company
@ 06/10/13
High
Low
Value
Value (2)
LTM
CY 2013E
CY 2014E
LTM
CY 2013E
CY 2014E
LTM
CY 2013E
CY 2014E
QUALCOMM Incorporated
$62.03
$68.50
$53.09
$107,178
$93,724
4.3 x
3.7 x
3.4 x
12.3 x
9.6 x
8.7 x
17.2 x
13.7 x
12.7 x
Trimble Navigation Limited
26.79
32.03
20.01
6,853
7,646
3.7
3.3
3.0
19.3
21.0
18.1
36.3 x
18.0 x
15.3 x
Elbit Systems Ltd.
44.69
44.78
31.72
1,882
2,337
0.8
0.8
0.8
6.7
6.6
6.4
10.4 x
10.3 x
9.9 x
Zebra Technologies Corp.
45.95
47.24
31.79
2,340
1,926
1.9
1.9
1.8
10.4
9.8
8.8
20.1 x
17.4 x
15.5 x
Fleetmatics Group PLC
31.44
31.61
19.20
1,089
1,011
7.3
6.1
4.9
35.9
21.5
16.2
148.3 x
44.0 x
33.0 x
Astronics Corporation
39.52
39.63
19.25
571
582
2.1
1.8
1.5
14.0
10.7
8.1
23.5 x
20.0 x
16.8 x
Median
$2,111
$2,131
2.9 x
2.6 x
2.4 x
13.1 x
10.2 x
8.8 x
21.8 x
17.7 x
15.4 x
Mean
19,986
17,871
3.4
2.9
2.6
16.4
13.2
11.1
42.6
20.6
17.2
Source: Bloomberg and Wall Street Research
Note: LTM = Latest Twelve Months
NM = Not Meaningful; NA = Not Available
(1) Stock price as of June 10, 2013
(2) Firm Value (FV) equals Equity Value plus debt less cash

Experienced Management Team
34
David Lucatz - Chairman of the Board and CEO
• 25 years’ experience with a successful track record in operations, finance, business development
and management, including:
and management, including:
• Co-owner of ITL Optronics Ltd., an advanced electronics supplier to the defense and security
industries, listed on the Tel Aviv Stock Exchange
industries, listed on the Tel Aviv Stock Exchange
• CEO of Taliplast, a leading manufacturer of Plastic products
• EVP of Securitas, a public finance investments group
Tali Dinar - Chief Financial Officer
• 15 years’ experience managing financial operations in the homeland and defense industries
• Former Manager at Kost Forer Gabbay & Kassierer, a member of Ernst & Young Global
• A former Chief Controller of GCST, a major Global Homeland Security Group, and ITL Optronics

Experienced Management Team (cont.)
35
Rafael Katz, CEO Micronet Ltd
• Experienced high-tech executive, Sales & Marketing background in Telecom industry
• Joined Micronet in 2002 - CEO since 2005 - led company’s IPO in late 2006
• 1997-2002 - CTMotion, Co-founder - CEO, Cellular Location Based Services
• 1988-1997 - Aerotel, VP Sales & Marketing, Computer Telephony Integration (Voice Response)
Zvi Avni, CEO Enertec Systems Ltd
• Mr. Avni is responsible for the unique position of Enertec as a certified supplier and partner for
development of special computers for the defense industry in Israel
development of special computers for the defense industry in Israel
• Mr. Avni graduated the Technion in 1982 and earned a degree as a practical electronic engineer
Investment Highlights
36
Experienced
Management Team
Management Team
§Deep industry expertise
§Proven track record
Diversified Platform
§Proven solution provider
§High-end product line
§Cutting-edge R&D
Improving Financials
§Strong balance sheet
§Growing revenues &
expanding profitability
expanding profitability
Growing Billion $
Global Markets
Global Markets
§Civilian & military
applications
applications
§Major global industry-
leading customers
leading customers
§Organic and M&A focus